Dashboard
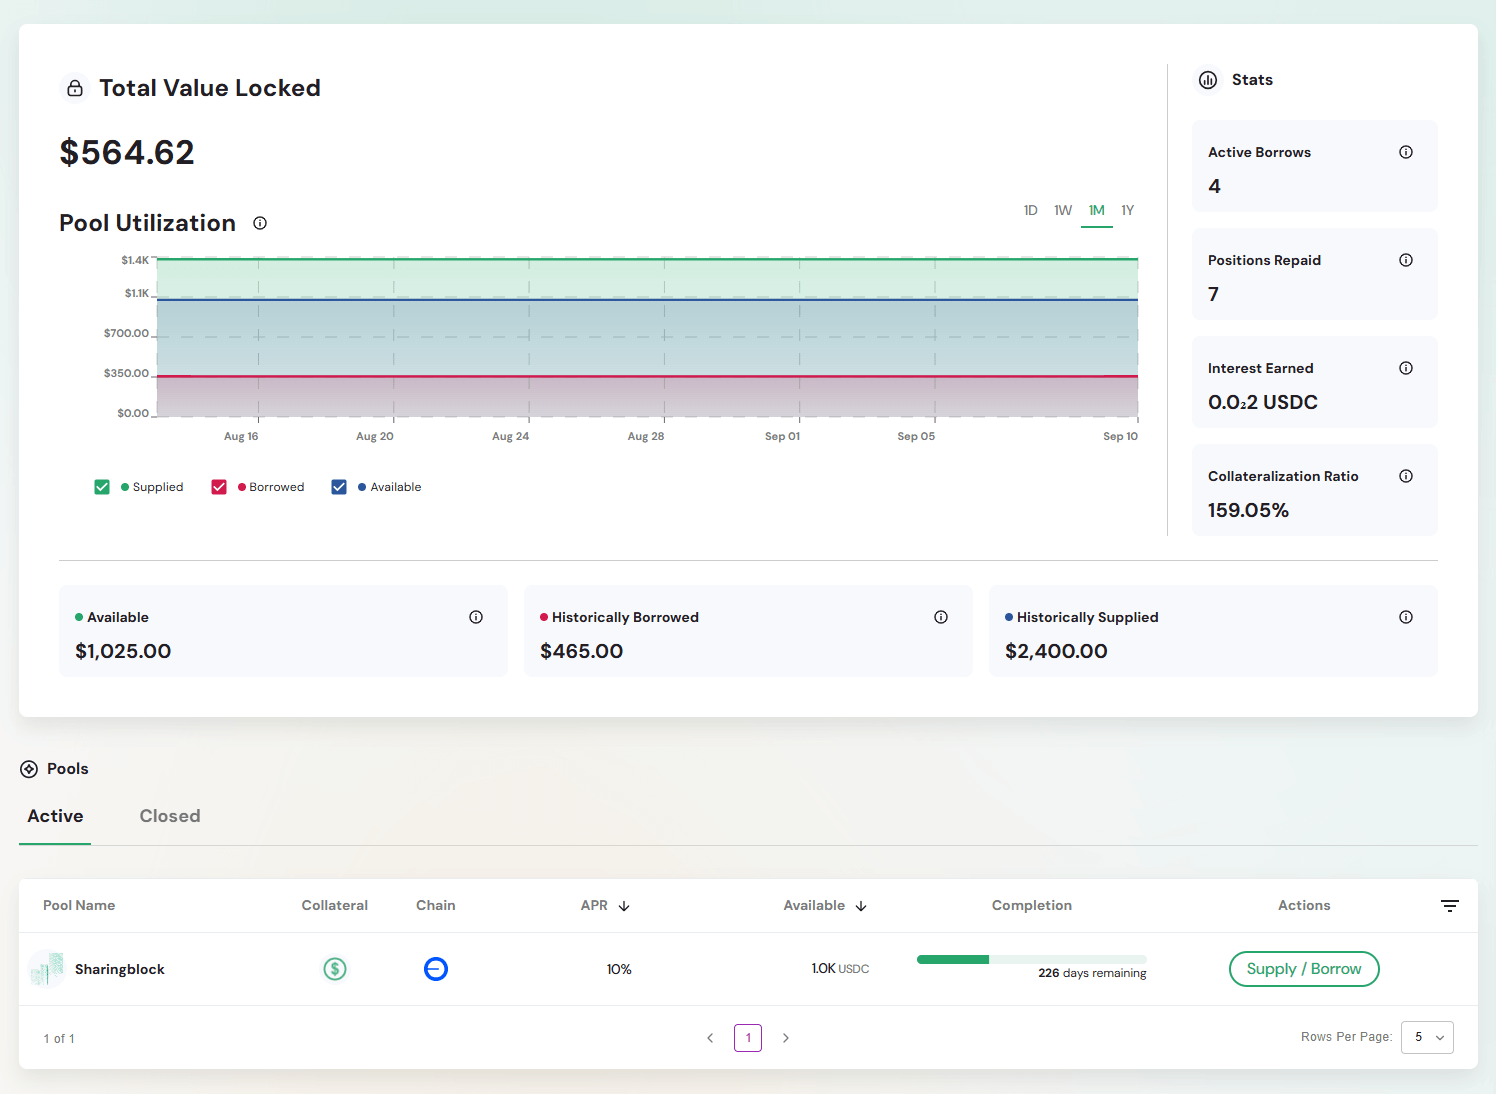
The Pools Dashboard is your main control center for managing lending and borrowing on the Defactor platform. It brings together key metrics, liquidity insights, and quick actions so you can easily track pool activity and manage your positions.
Dashboard Overview
The dashboard provides:
- Total Value Locked (TVL) – Overall assets supplied across pools
- Pool Utilization Chart – Interactive chart showing supply, borrow, and available liquidity over time
- Pool Activity Summary – Key metrics for available liquidity, historically borrowed, and historically supplied assets
- Personal Performance Metrics – Track your active borrows, repayments, interest earned, and collateralization ratio
- Active and Closed Pools Table – Manage pool positions with direct supply/borrow actions
Key Metrics Overview
Total Value Locked (TVL)

Large numerical display showing total value locked, placed centrally to highlight its importance.
Reflects the total value of assets you have supplied to pools.
Pool Utilization Chart
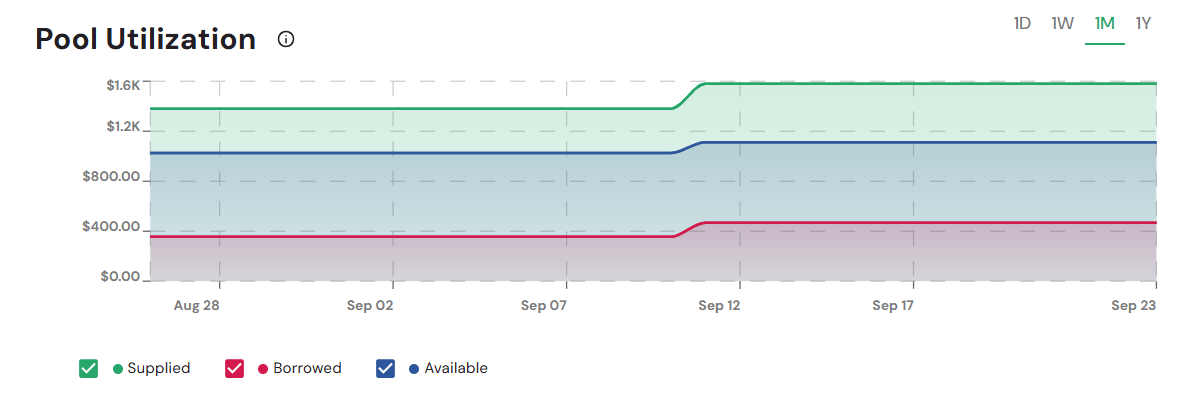
The Pool Utilization Chart provides a visual breakdown of liquidity over time. It shows how much has been supplied, borrowed, and remains available in the pools.
Interactive Time Series Visualization
- Multi-line chart with selectable filters:
- 1D – View changes within the last 1 day
- 1W – View changes within the last 1 week
- 1M – View changes within the last 1 month
- 1Y – View changes within the last 1 year
Chart Legend

- Supplied – Assets you’ve provided to pools (green line)
- Borrowed – Assets borrowed from pools (red/pink line)
- Available – Liquidity remaining in pools for borrowing (blue line)
Tooltip Details
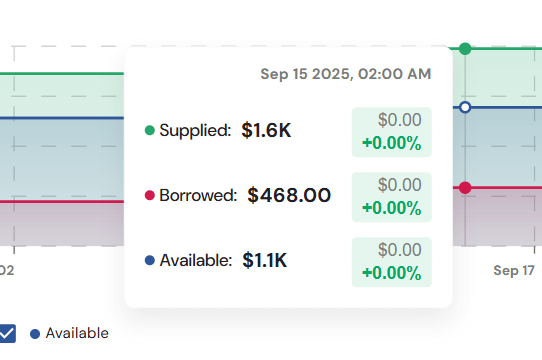
When hovering over the chart, a tooltip displays exact values for the selected time point:
- Supplied – Amount currently supplied to pools
- Borrowed – Amount currently borrowed from pools
- Available – Liquidity still available in pools
This chart helps users quickly understand liquidity trends and balance between supplied, borrowed, and available assets over different timeframes.
Pool Activity Summary

The Pool Activity Summary highlights three key liquidity metrics, each with contextual explanations available via tooltips:
- Available – Net funds accessible for borrowing or withdrawal from the active pool, calculated as Total Supplied minus Total Borrowed.
- Historically Borrowed – The total amount that has ever been borrowed from the pool, including all borrowing regardless of repayment status.
- Historically Supplied – The cumulative amount that has been supplied into the pool across all periods, without considering the current status of those funds.
These metrics provide quick insight into pool health by showing how much liquidity remains available, how much has been borrowed, and the total supply history.
Active and Closed Pools Table
Status Tabs
- Active – Currently operational pools
- Closed – Completed or inactive pools
Active Pools Table
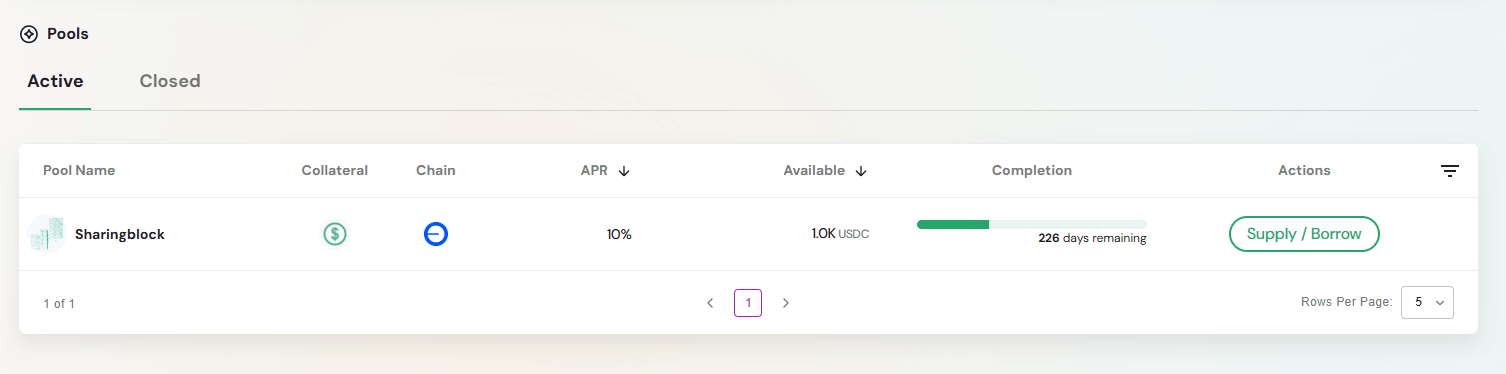
Column Structure:
- Pool Name – Identifier and branding
- Collateral – Accepted collateral types
- Chain – Blockchain network (chain icons shown)
- APR – Annual Percentage Rate (sortable)
- Available – Liquidity available for borrowing (sortable)
- Completion – Timeline and progress
- Actions – Supply / Borrow options
This table helps you compare pool conditions and take action directly from the dashboard.
Pool Interaction Workflow
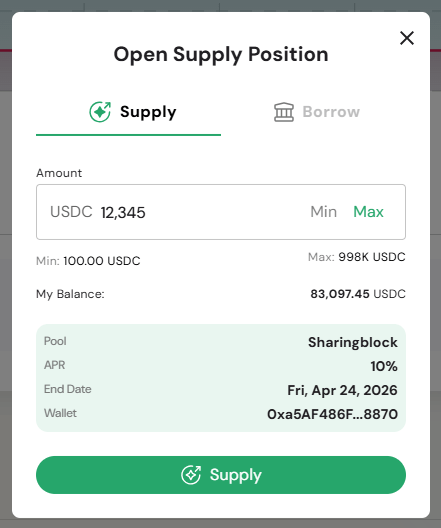
Both Supply and Borrow actions follow the same process:
- Click Supply / Borrow
- Select the desired action (Supply or Borrow)
- Enter the amount (within limits)
- Confirm the transaction
A unified workflow makes it easy to manage both supplying and borrowing through a consistent interface.
