Vesting
The Vesting Module enables controlled token distribution over time to contributors, team members, investors, and other stakeholders. This module provides transparency and predictability for token releases while maintaining ecosystem stability through gradual emission schedules.
Users can monitor their vesting progress, view emission charts, track claimable amounts, and manage their vesting events through an intuitive dashboard interface.
Dashboard Overview
The vesting dashboard displays comprehensive vesting metrics and provides three main event views:
- Ongoing Events – Currently active vesting schedules
- Upcoming Events – Future vesting batches yet to begin
- Completed Events – Finished vesting schedules
Users can seamlessly switch between these views to monitor active vesting progress, preview upcoming distributions, and review completed vesting history.
Vesting Metrics
The dashboard displays comprehensive vesting statistics and personal tracking information.
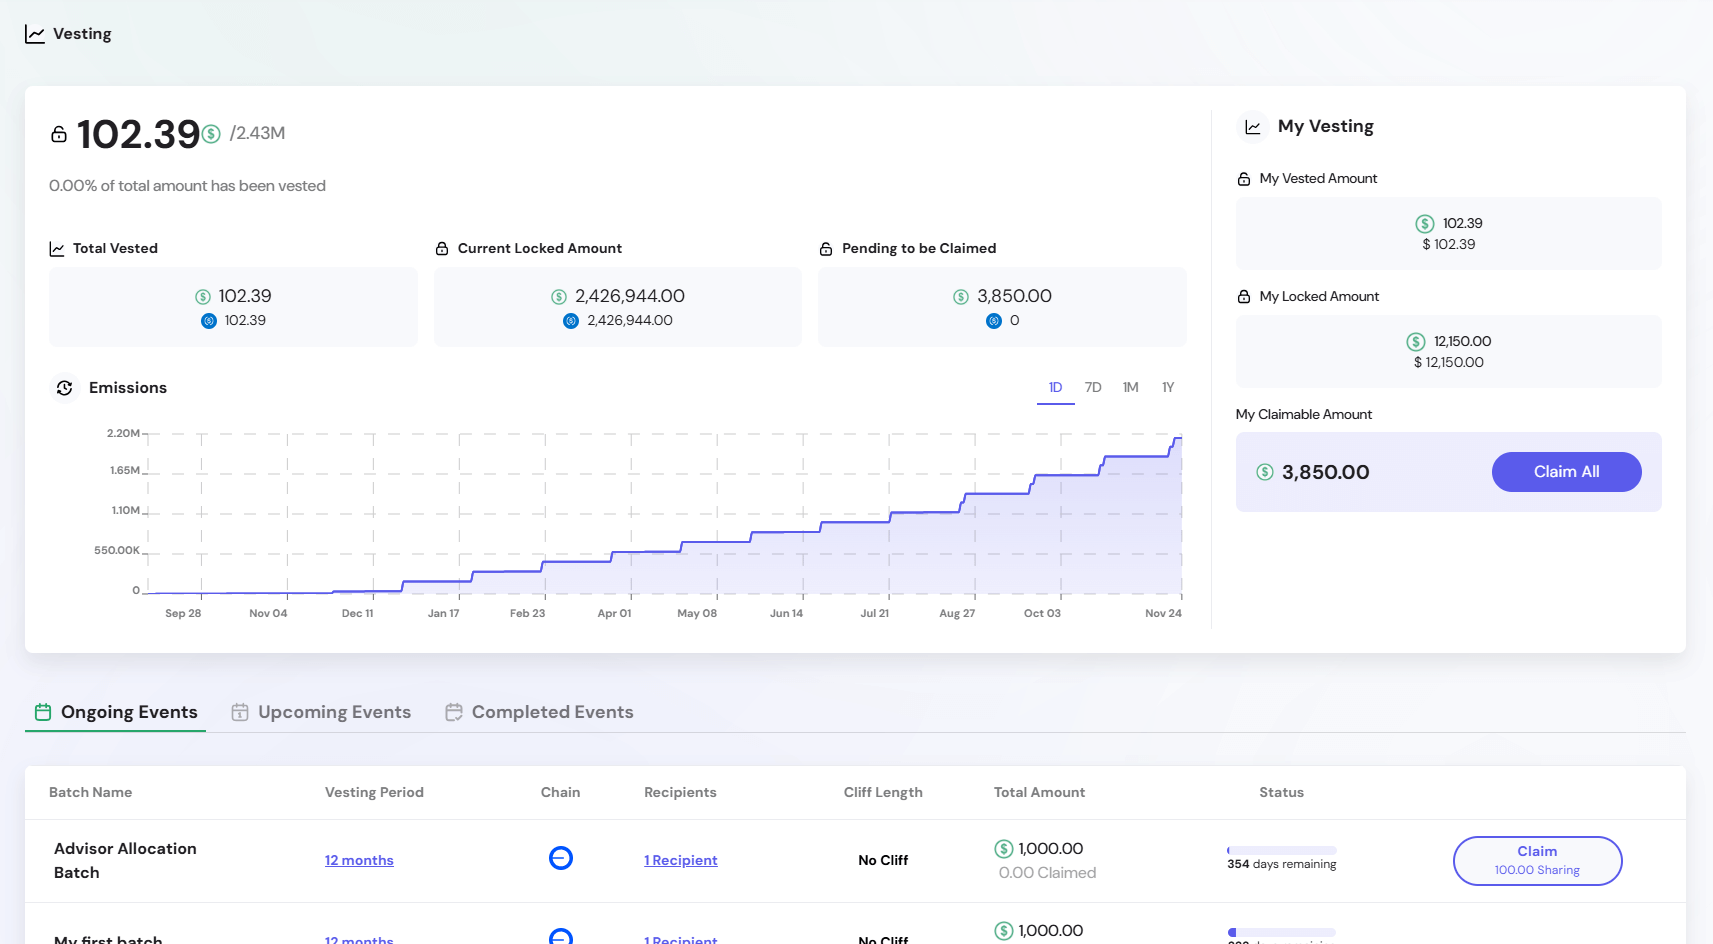
Vesting Progress Overview

The vesting progress section displays:
- Current Vested Amount – Shows tokens currently vested out of total allocation (e.g., 2.84K /16.48M)
- Progress Percentage – Indicates the percentage of total allocation that has been vested to date
- Lock Icon – Visual indicator showing that tokens are part of a controlled vesting schedule
This section provides a quick overview of overall vesting progress across all active schedules.
Key Vesting Statistics
System-Wide Metrics:

- Total Vested – Aggregate tokens released across all participants
- Current Locked Amount – Tokens currently locked in active vesting schedules
- Pending to be Claimed – Vested tokens available for withdrawal
Personal Metrics:
The My Vesting section provides personalized vesting information.

- My Vested Amount – Total tokens you've received with USD value
- My Locked Amount – Your tokens currently locked in vesting
- My Claimable Amount – Tokens ready for immediate withdrawal
Claim Functionality
- Claim All Button – One-click claiming of all available vested tokens
Emissions Chart

The emissions chart provides visual tracking of token release over time with an interactive timeline display.
Chart Features
- Timeline View – Historical token releases displayed over months with cumulative growth
- Time Filters – Toggle between 1D, 7D, 1M, and 1Y views in the top-right corner
- Interactive Tooltip – Hover over data points to see specific emission details, timestamps, total emissions amount, and percentage changes
- Cumulative Display – Shows total accumulated emissions as a rising line chart over the selected time period
Tooltip Information

When hovering over chart data points, the tooltip displays:
- Date and Time – Specific timestamp for the data point
- Total Emissions – Cumulative token amount released up to that point
- Percentage Change – Growth percentage showing emission changes from baseline
Vesting Events
The vesting events table displays detailed information about all vesting schedules.
Event Categories
- Ongoing Events – Active vesting schedules currently distributing tokens
- Upcoming Events – Future vesting batches scheduled to begin
- Completed Events – Finished vesting schedules
Event Details
Each vesting event displays detailed information depending on its lifecycle stage.
Ongoing Events:
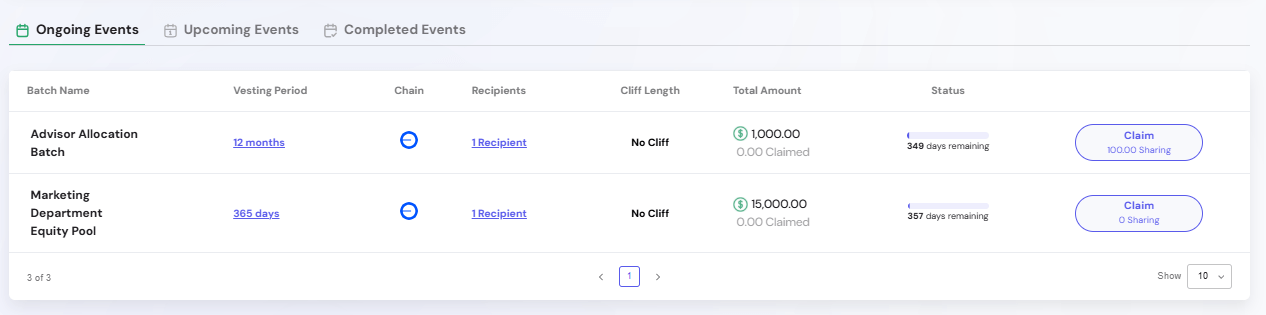
- Batch Name – Descriptive identifier for the vesting schedule
- Vesting Period – Duration of the token release schedule (shown as a clickable link)
The format (seconds, days, weeks, or months) depends on the chosen distribution frequency when the batch is created.

- Chain – Blockchain network where vesting occurs (indicated by network logo)
- Recipients – Number of participants in the vesting batch (clickable to view recipient details)

- Cliff Length – Initial lock period before vesting starts (shows "No Cliff" if none configured)
- Total Amount – Total tokens allocated with claimed/unclaimed breakdown
- Status – Shows the time remaining until the vesting schedule is completed
- Claim Button – Appears only for ongoing events, showing claimable amount
Upcoming Events:
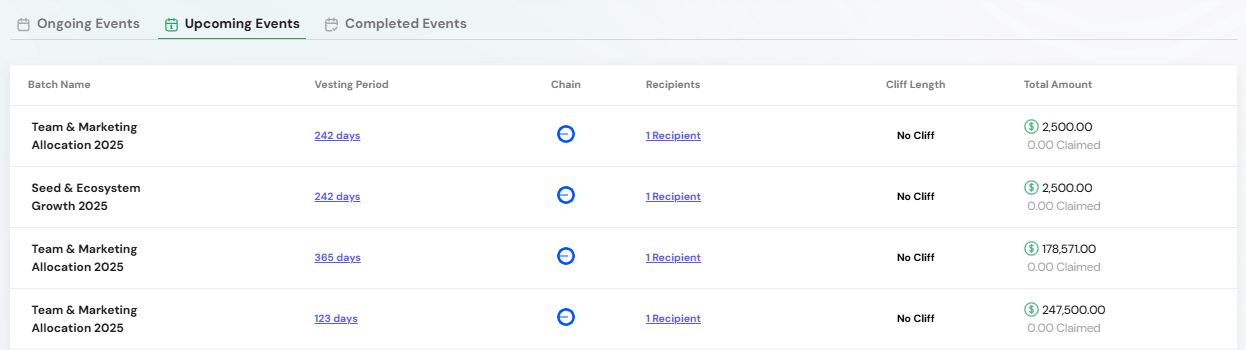
- Batch Name – Descriptive identifier for the vesting schedule
- Vesting Period – Duration of the token release schedule (shown as a clickable link)
The format (seconds, days, weeks, or months) depends on the chosen distribution frequency when the batch is created. - Chain – Blockchain network where vesting will occur (indicated by network logo)
- Recipients – Number of participants in the vesting batch (clickable to view recipient details)
- Cliff Length – Initial lock period before vesting starts (shows "No Cliff" if none configured)
- Total Amount – Total tokens allocated to the vesting schedule
Completed Events:
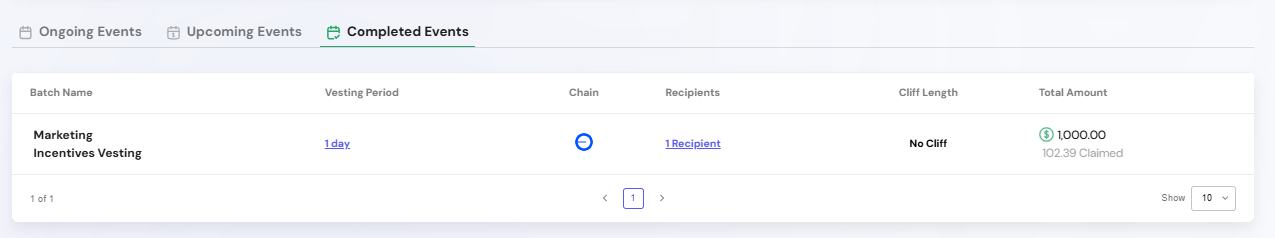
- Batch Name – Descriptive identifier for the vesting schedule
- Vesting Period – Duration of the token release schedule (shown as a clickable link)
The format (seconds, days, weeks, or months) depends on the chosen distribution frequency when the batch is created. - Chain – Blockchain network where vesting occurred (indicated by network logo)
- Recipients – Number of participants who received tokens (clickable to view recipient details)
- Cliff Length – Initial lock period before vesting starts (shows "No Cliff" if none configured)
- Total Amount – Total tokens that were distributed
Related Documentation
- Vesting Settings (Admin) – Administrative interface for creating and managing vesting schedules
