Ecosystem
The Ecosystem Module provides a real-time dashboard for monitoring the health and activity of the Engage token economy. It aggregates metrics like circulating supply, total staked value, liquidity allocations, buybacks, and expected rewards.
This module ensures transparency by showing both system-wide token metrics and detailed ecosystem wallet distributions. It is accessible to all users, while Admins configure wallets and allocations via the Admin → Ecosystem Settings.
Dashboard Overview
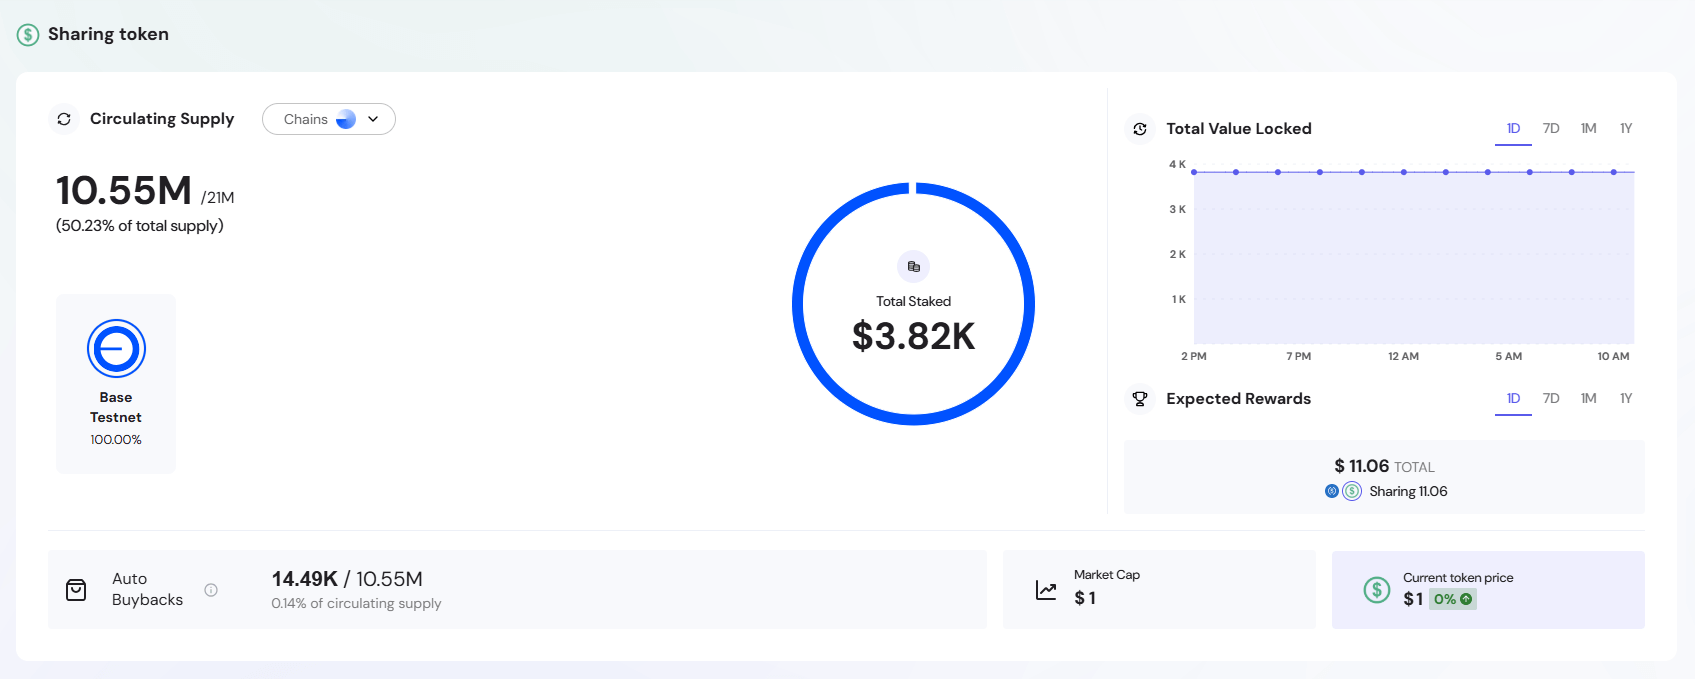
The ecosystem dashboard displays:
- Circulating Supply – Current tokens in circulation compared to total supply
- Network Distribution Badges – Visual indicators showing token allocation across different blockchain networks
- Chain Selector – Multi-chain dropdown menu for selecting supported networks
- Total Staked Value Chart – Circular visualization of USD equivalent tokens staked across networks
- TVL Historical Graph – Time-series chart of Total Value Locked with 1D, 7D, 1M, and 1Y filters
- Expected Rewards (App Type 1) - Projected earnings forecast for stakers over selected time periods / Total Buyback Amount (App Type 2) – Shows tokens repurchased from market and returned to ecosystem
- Auto Buybacks – (App Type 1) Tokens repurchased from market and returned to ecosystem / Staking banner (App Type 2) – Promotional banner for staking functionality
- Token Metrics – Market capitalization and current token price indicators
- Ecosystem Addresses Table (App Type 1) / Burn Events Table (App Type 2) – Token allocation or burn transaction details
Circulating Supply

Displays the current number of tokens in circulation compared to the total supply.
This metric helps users track inflation/deflation of the token and monitor how much of the total supply is actively available in the market.
Badges (Network Distribution)

The badges section displays the distribution of your token supply across different blockchain networks. Each badge represents a specific network where your tokens are deployed.
Network Badge Details
Each badge contains:
- Network Name - The blockchain network (e.g., Base Testnet, Ethereum, Polygon)
- Network Logo - Visual identifier for the blockchain
- Percentage - Proportion of your total token supply on this network
- Visual Indicator (Circle) - The colored circle surrounding each network logo provides a visual representation of the distribution percentage, making it easy to quickly compare allocations across networks.
Distribution Calculation
The percentage (%) shown in each badge indicates what portion of your total token supply exists on that specific blockchain network.
Chain(s) Selector

Toggle between supported chains such as Base, Ethereum, and Polygon.
Engage supports multi-chain compatibility, allowing users to view metrics across all integrated networks without switching applications.
Total Staked Value Chart

Shows the USD equivalent of all tokens currently staked across networks. The display features a circular progress indicator that visualizes the staking distribution.
This value reflects community participation and helps measure ecosystem security and engagement through staking.
Chart Elements
The Total Staked Value display includes:
- USD Amount - The total dollar value of all staked tokens across networks
- Visual Indicator (Circle) - Colored circular progress ring showing staking distribution across networks, with segments representing each network's proportion of the total staked value
Details Tooltip

When hovering over a specific colored segment of the chart circle, a tooltip appears displaying:
- Network Name - The specific blockchain
- Staked Amount - USD value staked on that network
- Percentage Distribution - Proportion of total staking on each network
The tooltip provides granular visibility into how staking is distributed across your supported blockchain networks, helping users understand which networks have the highest staking participation.
TVL Graph

Provides a historical chart of Total Value Locked (TVL), filterable by 1D, 7D, 1M, and 1Y.
Tracking TVL over time gives insights into growth trends, liquidity inflows, and long-term holder confidence.
Expected Rewards (App Type 1)

Displays projected rewards to be earned by stakers and participants over a chosen time period.
This forecast helps users estimate returns based on staking activity and pool performance.
Total Buyback Amount (App Type 2)
Displays the total value of tokens repurchased from the market through buyback programs. This component shows both USD value spent and token amounts acquired through buyback operations.
Two circular icons allow users to switch between viewing USD value spent and token amounts repurchased:
- USD View – Shows total dollar amount spent on buybacks, representing the USD value invested in token repurchases from the market

- Token View – Displays total tokens acquired through buybacks, showing the actual token quantity repurchased and returned to the ecosystem

Buyback programs help reduce circulating supply and demonstrate the project's commitment to token value preservation, potentially creating deflationary pressure that benefits existing token holders.
Auto BuyBacks (App Type 1)
Displays the total number of tokens repurchased from the market and returned to the ecosystem.
The metric shows the absolute buyback amount, the current circulating supply, and the percentage of supply repurchased.

Staking Banner (App Type 2)
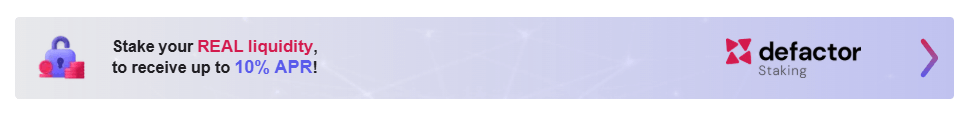
Promotional banner encouraging users to stake their tokens for rewards. Displays current APR rates and provides direct access to staking functionality.
Banner Content
- Call-to-Action – "Stake your [TOKEN] liquidity, to receive up to [X]% APR!"
- Dynamic APR – Shows maximum available APR from active staking plans
- Navigation – Clicking navigates to staking section
- Coming Soon State – Shows preview message when staking is disabled
Replaces Auto Buybacks section in App Type 2, focusing users on staking opportunities.
Token Metrics

- Market Cap – Calculated based on circulating supply × token price.
- Current Token Price – Fetched from Coingecko or defined as fixed in Admin → Token Settings.
Ecosystem Addresses (App Type 1)
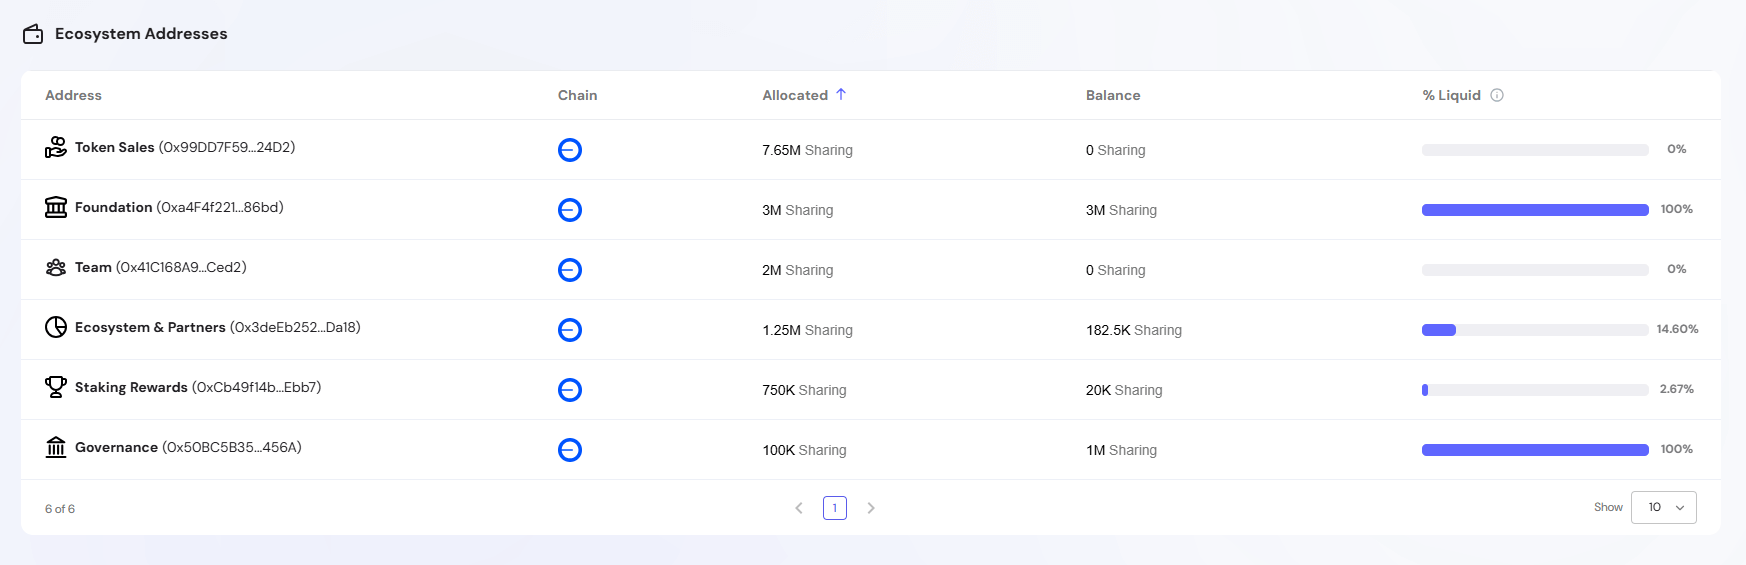
The Ecosystem Addresses table displays token allocation details for each tracked wallet within the ecosystem, providing transparency into how tokens are distributed across different organizational functions.
Ecosystem Address Details
- Address Label – Descriptive name for the wallet's purpose (e.g., Token Sales, Foundation, Team, Ecosystem & Partners, Staking Rewards, Governance)
- Wallet Address – The blockchain address of the ecosystem wallet
- Allocated – Total tokens originally assigned to this address
- Balance – Current token balance remaining in the wallet
- % Liquid – Percentage of tokens that are unlocked and available for use
This table helps stakeholders understand token distribution patterns and track how allocated funds are being utilized across different ecosystem functions.
Configuration
Admins configure these wallet addresses and their allocations through Admin → Ecosystem Settings.
Burn Events Table (App Type 2)
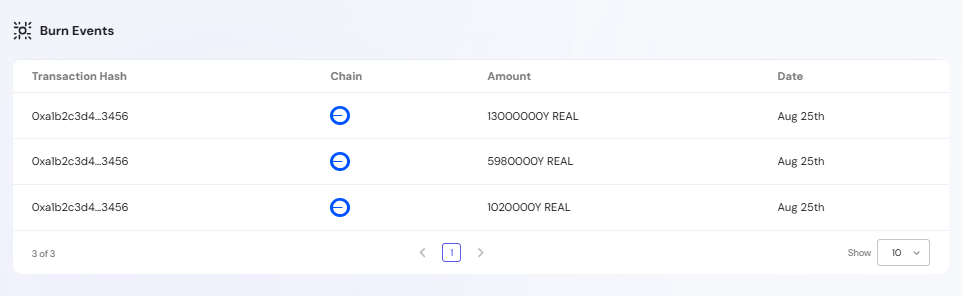
The Burn Events table tracks all token burn transactions, providing transparency into supply reduction activities that permanently remove tokens from circulation.
Table Columns
- Transaction Hash – Blockchain transaction identifier for the burn event
- Chain – The blockchain network where the burn occurred (displayed with network icon)
- Amount – Number of tokens permanently removed from circulation
- Date – When the burn transaction was executed
Token burns permanently reduce the total supply, creating deflationary pressure that can increase scarcity and potentially benefit remaining token holders by making their tokens more valuable.
App Types
Some features in this dashboard differ depending on your application’s configuration:
- App Type 1 – Deployments that include the staking module. These dashboards display features like Expected Rewards, Auto Buybacks, and an Ecosystem Addresses table.
- App Type 2 – Deployments that focus on buyback and burn mechanisms. These dashboards display features like Total Buyback Amount, a Staking Banner, and a Burn Events table.
Throughout this documentation, references to “App Type 1” and “App Type 2” indicate which feature set applies to your deployment.
